


08 Oct 2025 Q3 Student of the Markets
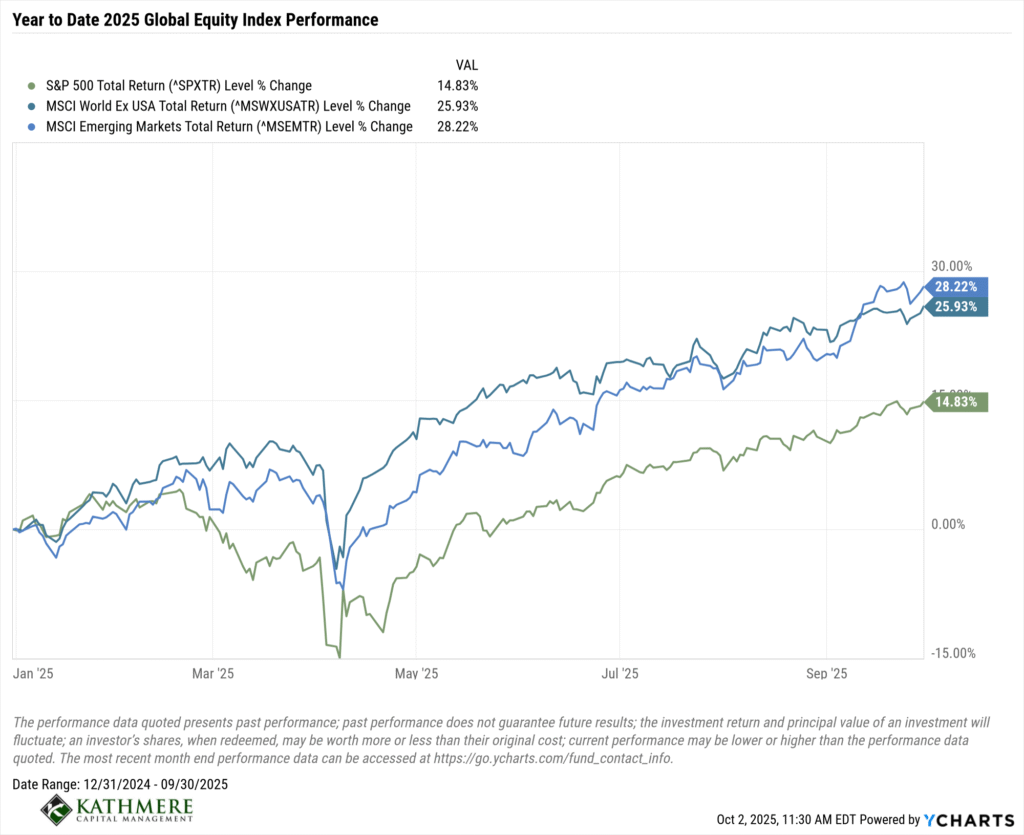
Global equity markets have surged since bottoming in early April, delivering strong cumulative year-to-date performance with foreign stocks leading the way.
Research from Vanguard shows that historically, when foreign stocks have outperformed over the course of a year, that outperformance has tended to persist into the future.
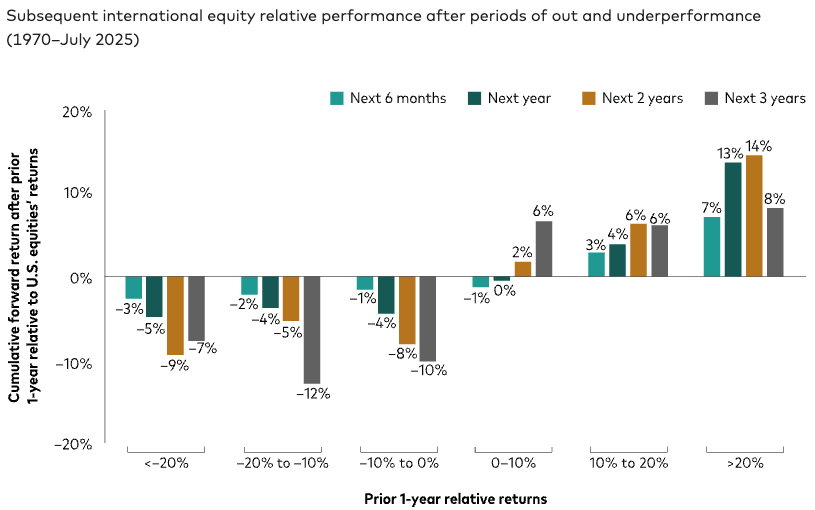 Notes: International equity: MSCI World ex USA Index (USD) from 1970 through June 1994, MSCI All-Country World ex USA Investable Market Index (USD) thereafter. US equity: S&P 500 Index from 1970 through June 1994, MSCI USA Investable Market Index from July 1994 through June 2001, CRSP U.S. Total Market Index thereafter.
Source: Vanguard Investment Advisory Research Center analysis using data from Morningstar Direct as of July 31, 2025.
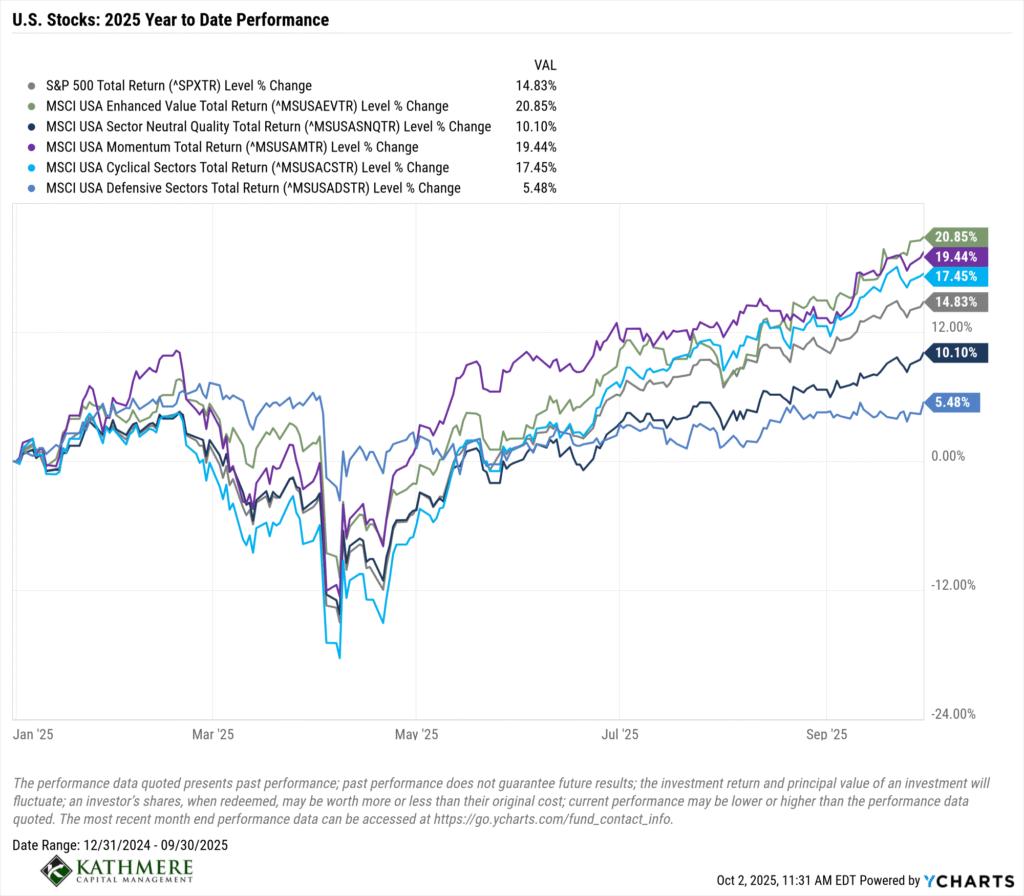
From a factor perspective, within U.S. stocks, value, momentum and cyclical stocks have led the way thus far in 2025 while high quality and defensive stocks have lagged.
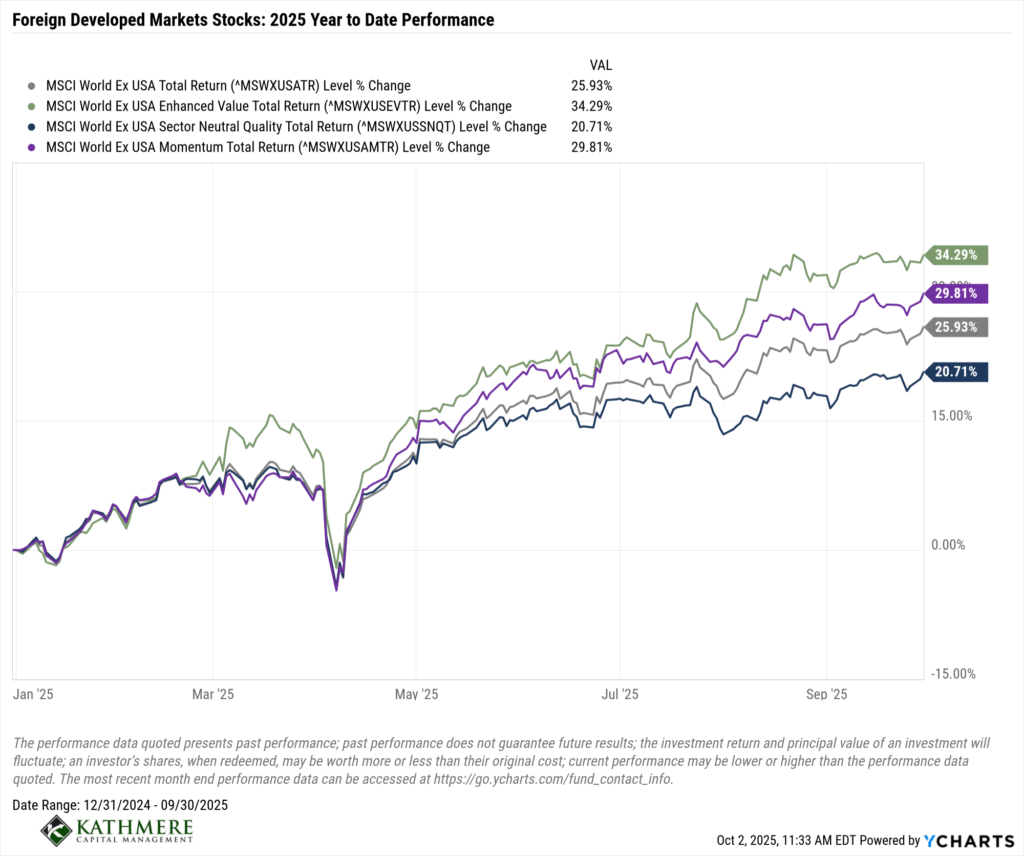
Beyond U.S. borders, within developed markets, value and momentum have led the way while quality has lagged.
The rally in U.S. stocks has been rather narrow as many stocks in the market continue to trade well below their 52-week high according to data from Goldman Sachs.
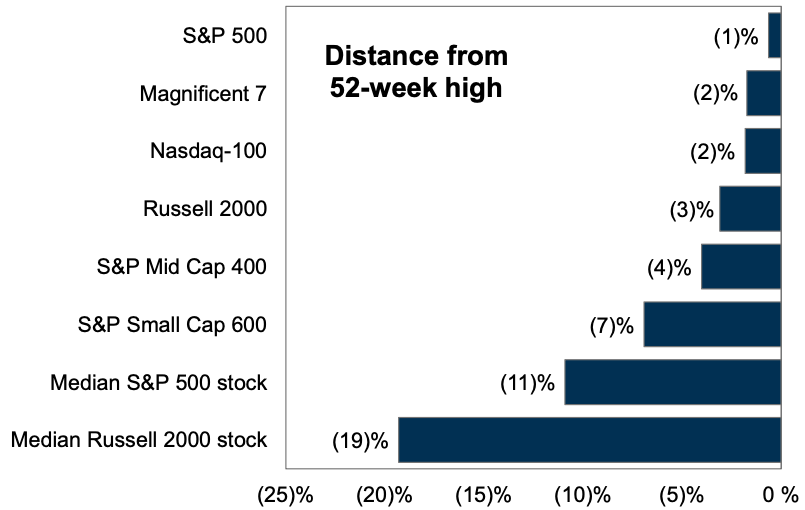 Source: Goldman Sachs Global Investment Research. As of August 25, 2025.
Further demonstrative of the narrowness of U.S. market performance and its reliance on the performance of a select few stocks, European and Japanese stocks have remarkably outperformed the S&P 500 Index excluding NVIDA since the S&P 500 bottomed in October 2022.
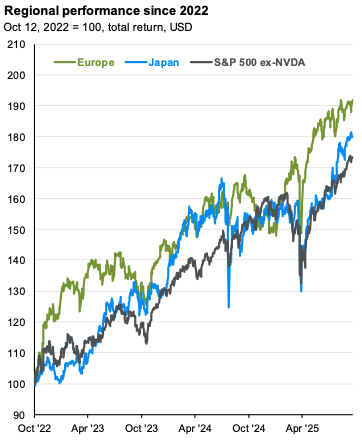
Source: FactSet, MSCI, Standard & Poor’s, J.P. Morgan Asset Management. 10/12/2022 was the market bottom for U.S. equities. Guide to the Markets – U.S. Data are as of September 30, 2025.
This year’s rally in U.S. stocks has been driven mostly by fundamentals (i.e., profit growth and dividends); however, expanding multiples (i.e., the market becoming more expensively valued) have played a role too.
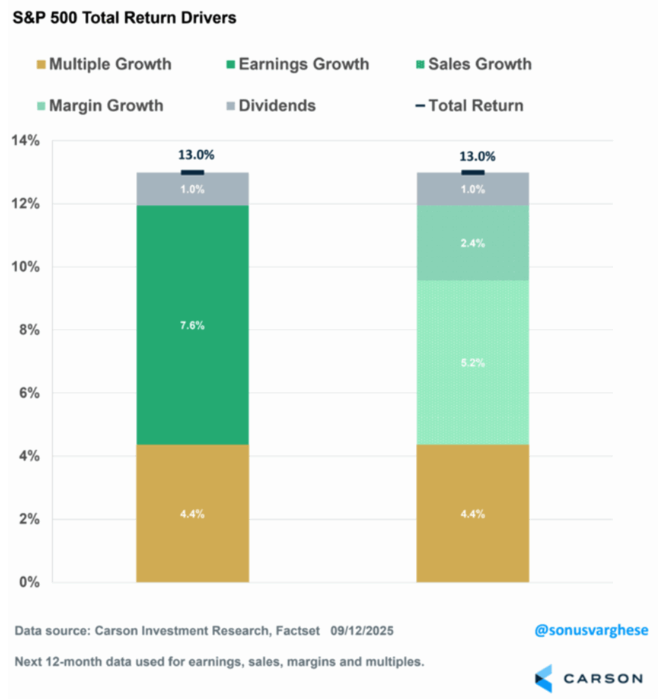
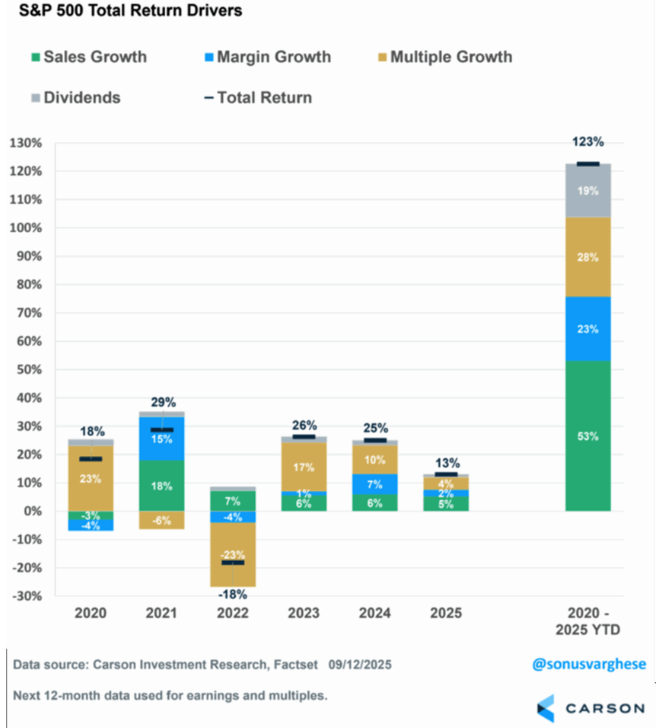
This year’s performance is not necessarily unique either but rather a continuation of the dynamic that’s more or less been in place over the last five plus years. The chart below demonstrates that more than 70% of the S&P 500’s return over the last five and a half years (since 2019) has come from profit growth and dividends, with roughly 30% coming from multiple expansion.
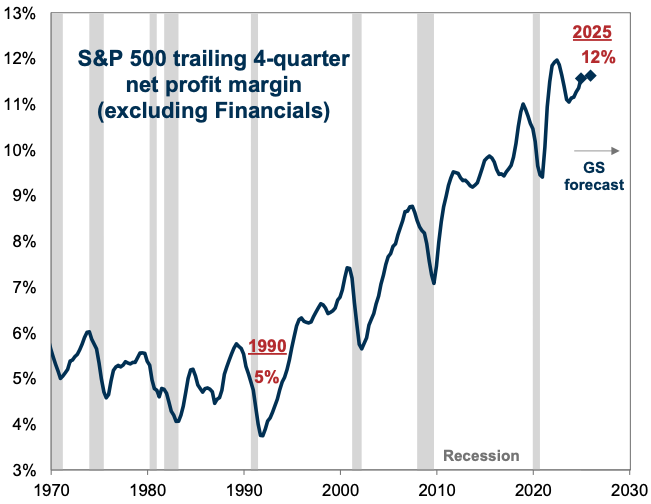
In addition to strong top-line sales growth, a key contributor to S&P 500 earnings growth has been margin expansion. Data from Goldman Sachs shows that S&P 500 (excluding financials) profit margins have been on a nearly relentless march higher over the last 35 years.
Source: Goldman Sachs Global Investment Research. 9/4/2025.
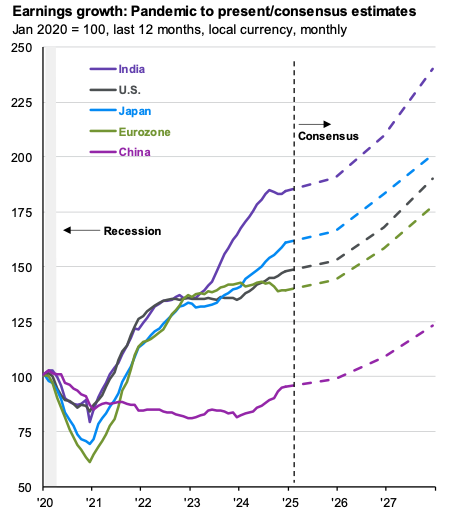
While much attention has rightfully be given to the strong earnings growth delivered by domestic companies, it’s also worth noting that foreign companies have also registered strong earnings growth since the Covid pandemic with further strong growth expected in 2026 and beyond.
Source: FactSet, MSCI, Standard & Poor’s, J.P. Morgan Asset Management. Countries are represented by their respective MSCI country index except for the U.S., which is represented by the S&P 500. Past performance is not a reliable indicator of current and future results.
Guide to the Markets – U.S. Data are as of September 30, 2025.Guide to the Markets – U.S. Data are as of September 30, 2025.
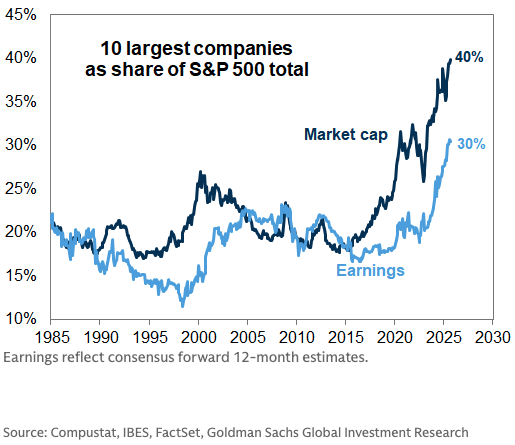
The U.S. market continues to become increasingly top-heavy with the top 10 names in the S&P 500 Index now accounting for 40% of the index. Those same 10 names account for a 30% of the index’s earnings.
Source: Compustat, IBES, FactSet, Goldman Sachs Global Investment Research. 9/5/2025.
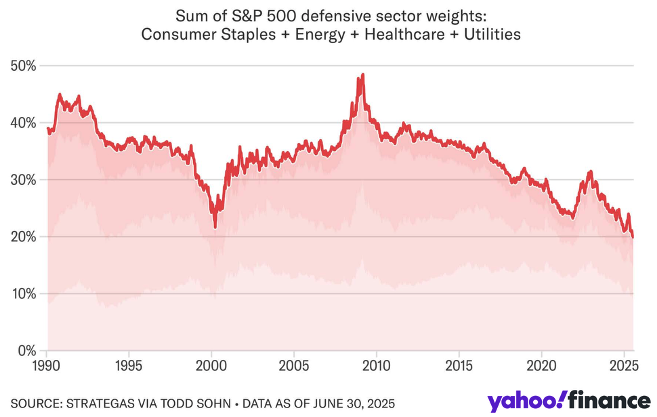
As the S&P 500 becomes increasingly concentrated in a small number of technology, communication services and consumer discretionary companies, the index in aggregate has become decreasingly comprised of stocks from defensive sectors like consumer staples, energy, health care and utilities.
The Magnificent 7 stocks collectively trade at a significant valuation premium to the remaining stocks in the S&P 500 Index.
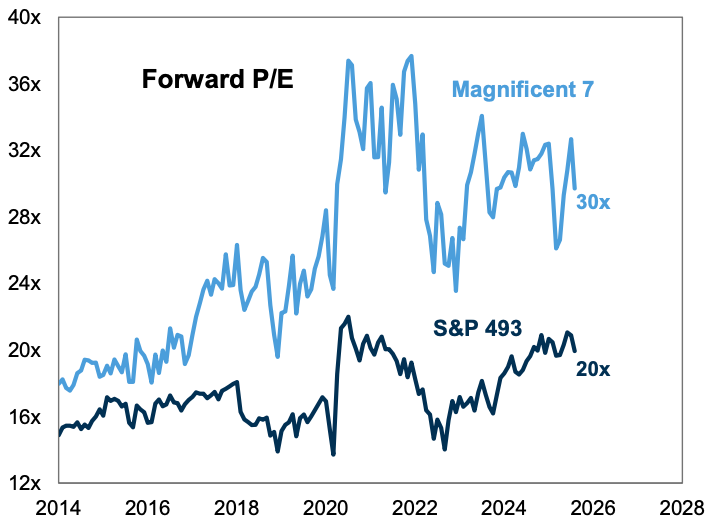
Magnificent 7 includes AAPL, AMZN, GOOGL/GOOG, META, MSFT, NVDA and TSLA.
Source: Goldman Sachs Global Investment Research. 8/29/2025.
The valuation premium on the Magnificent 7 may be well deserved given their superior earnings growth over the last five years. However, sustaining such impressive growth may be challenging for a variety of reasons. In any case, it’s worth nothing that analysts are projecting earnings growth will slow some over the next three years for these companies to levels that collectively are only marginally higher than that of the rest of the S&P 500.
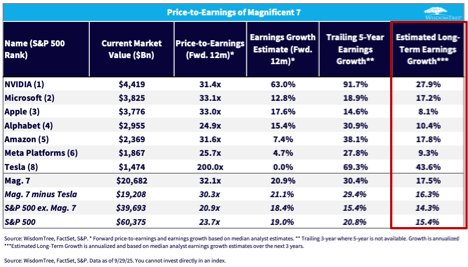
The combination of a top-heavy market that’s increasingly concentrated in expensively valued stocks has driven the overall U.S. market to historically high valuations.
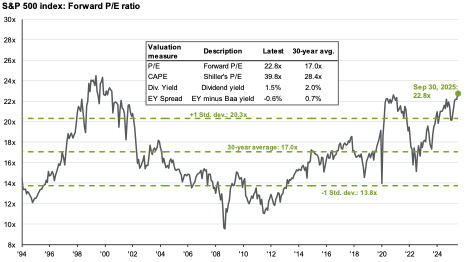 Source: Bloomberg, FactSet, Moody’s, Refinitiv Datastream, Robert Shiller, Standard & Poor’s, J.P. Morgan Asset Management.
Forward P/E ratio is the most recent S&P 500 index price divided by consensus analyst estimates for earnings in the next 12 months, provided by IBES since March 1994 and FactSet since January 2022. Shiller’s P/E uses trailing 10-years of inflation-adjusted earnings as reported by companies. Dividend yield is calculated as consensus estimates of dividends in the next 12 months, provided by FactSet, divided by the most recent S&P 500 index price. EY minus Baa yield is the forward earnings yield (the inverse of the forward P/E ratio) minus the Bloomberg U.S. corporate Baa yield since December 2008 and interpolated using the Moody’s Baa seasoned corporate bond yield for values beforehand.
Guide to the Markets – U.S. Data are as of September 30, 2025.
Within U.S. markets, valuations remain relatively more attractive for the equal-weighted version of the S&P 500 as well as within mid-cap (S&P Midcap 400 Index) and small-cap stocks (Russell 2000 Index), although not necessarily “cheap” either.
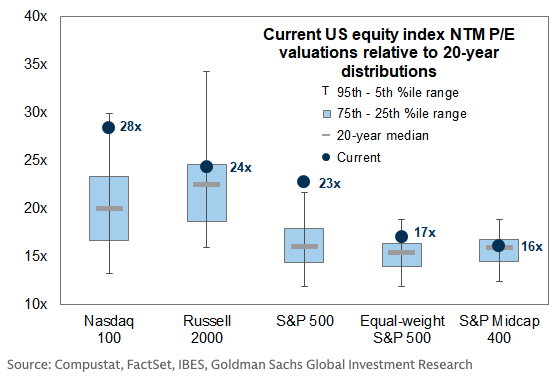
Source: Compustat, FactSet, IBES, Goldman Sachs Global Investment Research. 9/5/2025.
Non-U.S. markets are cheap relative to the U.S.; however, they are not particularly inexpensive relative to their own history.
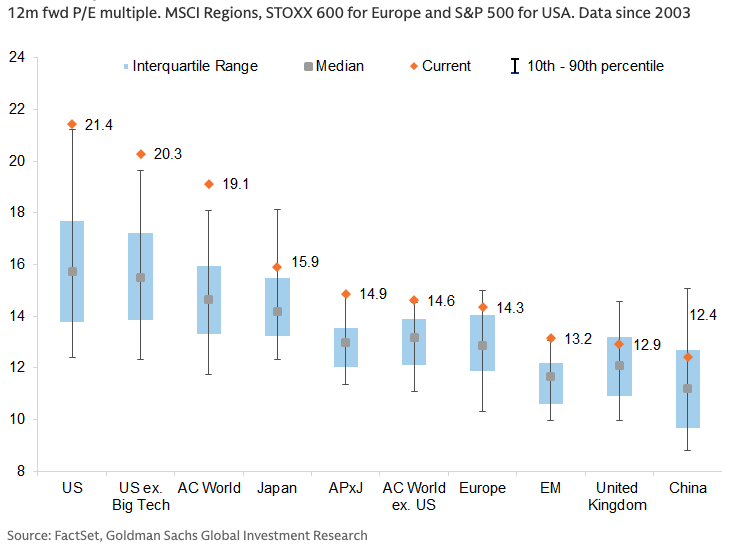 Source: FactSet, Goldman Sachs Global Investment Research. 9/3/2025.
Even with the market expensively valued and some warning of an impending pull back, it’s important to remember that even if a selloff is just over the horizon, big gains in the near term wouldn’t be unusual. Since 1950, the S&P 500 has gained an impressive 20% on average in the 12 months preceding the start of a bear market. Stretching the horizon back another 12 months reveals that the S&P 500 have risen 35% on average in the two years preceding a bear market.
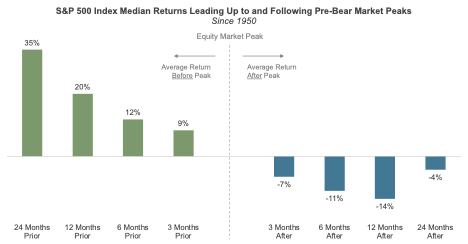 Past performance is not a guarantee of future results. Indices are not available for direct investment. Index performance does not reflect the expenses associated with the management of an actual portfolio.
Chart based on 11 U.S. equity bear markets since 1950. U.S. stocks measured by S&P 500 Index (price only). Bear market defined as a 20% or greater decline from an all-time high close. Daily closing values only.
Source: Kathmere calculations based on data from Ycharts.
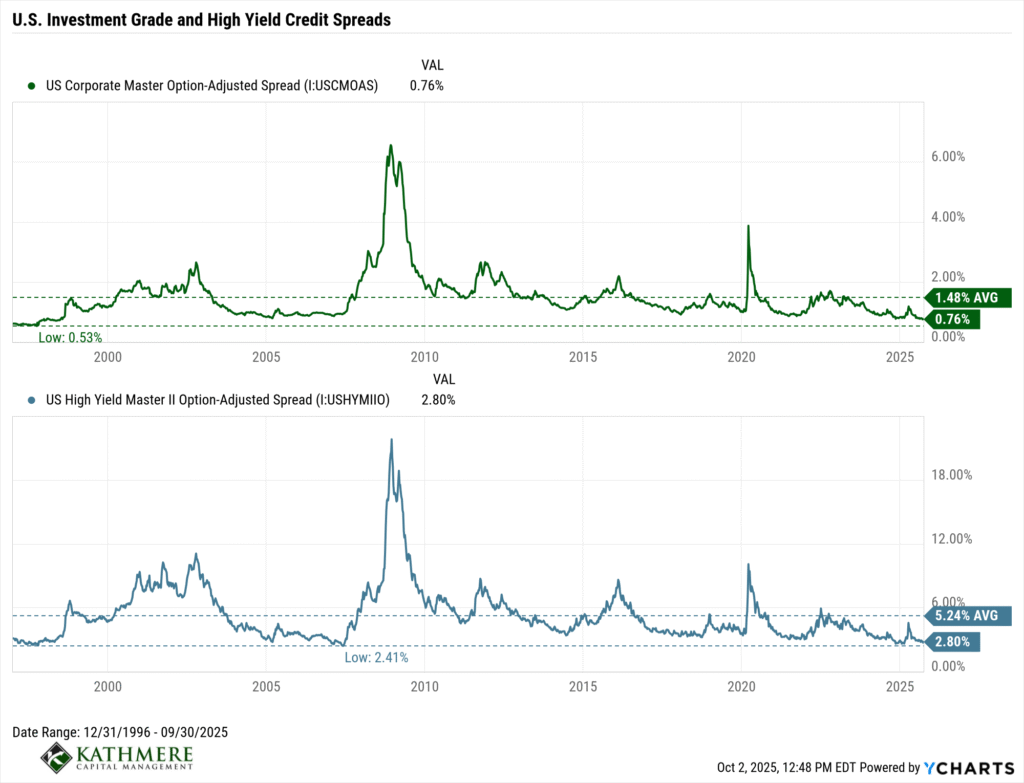
Amid and overall “risk-on” environment, U.S. large-cap stocks are not the only asset that’s expensively valued relative to its history. Credit spreads (i.e., the excess yield offered by credit-risky bonds relative to U.S. Treasury bonds as compensation for the risk of default or nonpayment) on publicly traded investment grade and high yield corporate bonds have declined significantly over the last few years and are approaching their lowest (i.e., most richly valued) levels over the last three decades.
Spreads on corporate private credit loans (i.e., direct lending) have noticeably tightened alongside of broader credit spreads. Notably, however, direct lending yields and spreads continue to outpace those of leveraged loans (i.e., publicly traded floating rate loans), as compensation for illiquidity.
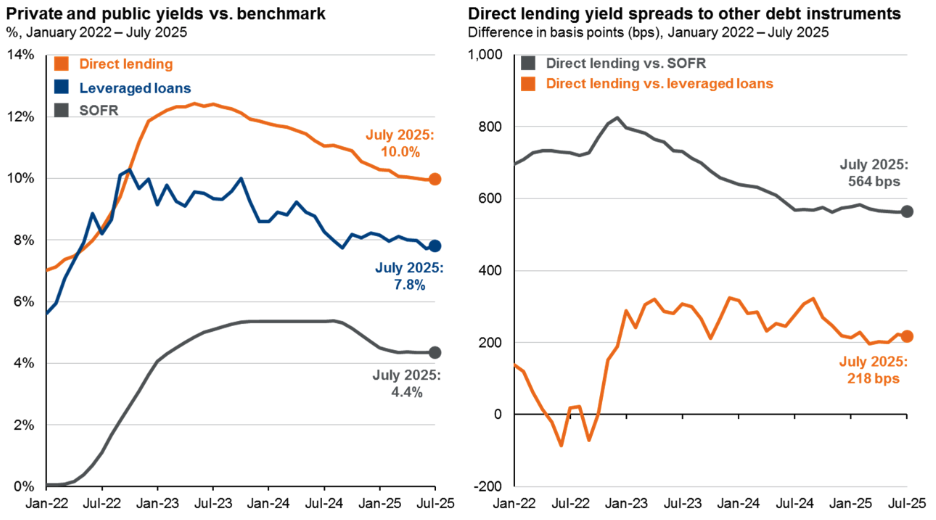 Source: FactSet, Federal Reserve Bank of New York, J.P. Morgan Credit Research, KBRA DLD, J.P. Morgan Asset Management.
SOFR: 90-day average Secured Overnight Financing Rate. Leveraged loans: yield-to-maturity from the J.P. Morgan Leveraged Loan Index. Private credit: yield-to-maturity from the KBRA DLD Index. (Right) The spreads are calculated by subtracting the monthly yield of the respective instrument from the monthly direct lending yield. Spreads and yields may not sum due to rounding. Past performance is not a reliable indicator of current and future results.
Guide to Alternatives. Data are based on availability as of August 31, 2025.
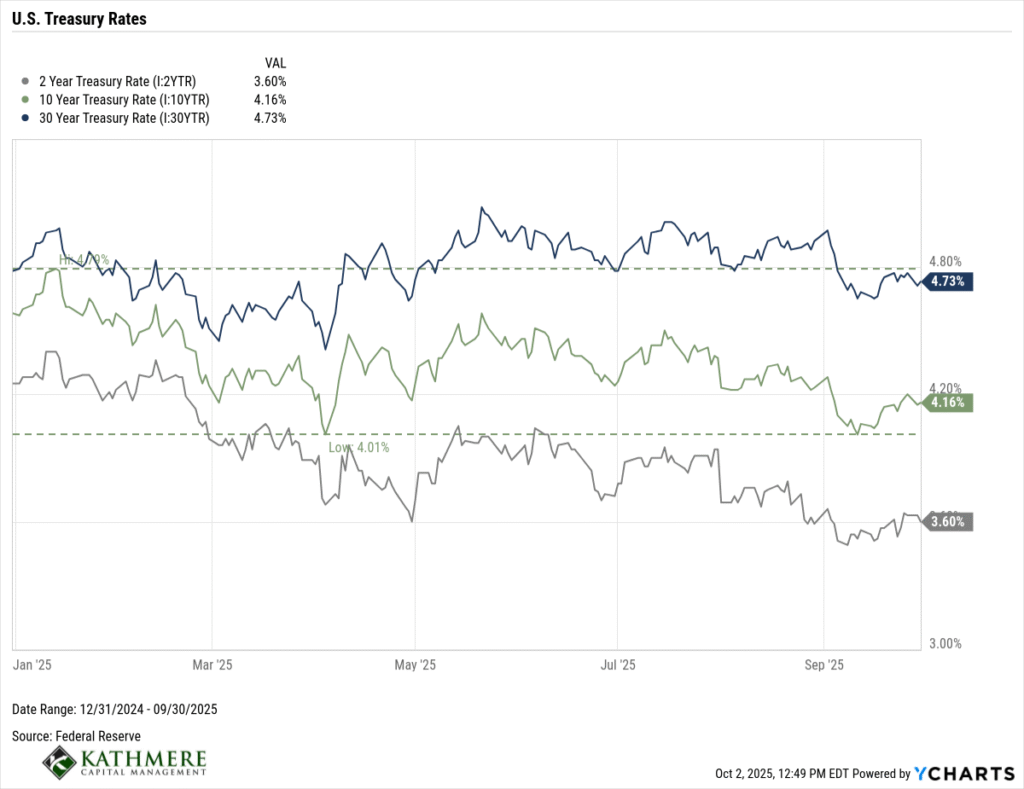
U.S. Treasury yields have been quite volatile this year amid a shifting global economic growth, inflation and monetary policy outlook and concerns about the long-term sustainability of the U.S. government’s fiscal position. For the year, however, key benchmark interest rates are broadly lower than where they began the year.
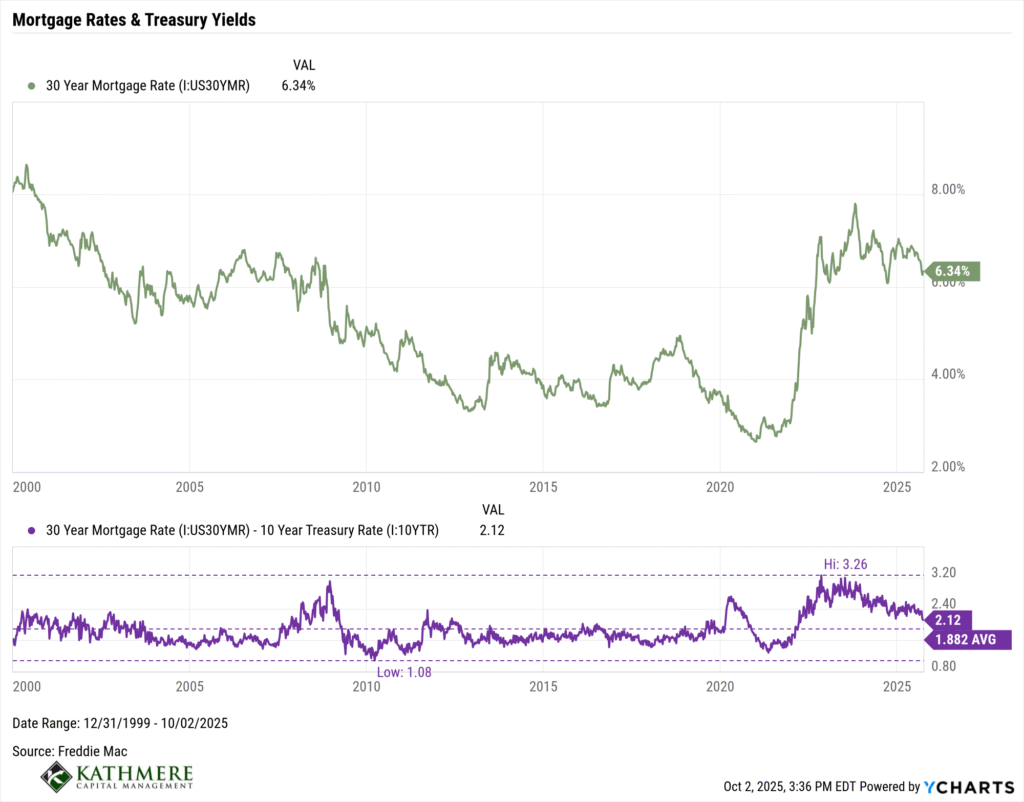
Mortgage rates have noticeably declined since peaking near 8% in late 2024 as the 10-Year Treasury yield fell and the “mortgage spread” (i.e., the excess rate charged on mortgages relative to 10-Year Treasuries as compensation for various mortgage related risks) compressed.
Based on the historical spread data shown below, mortgage rates could realistically fall another 0.25-0.50% from here absent further downward moves in the 10-Year Treasury yield.
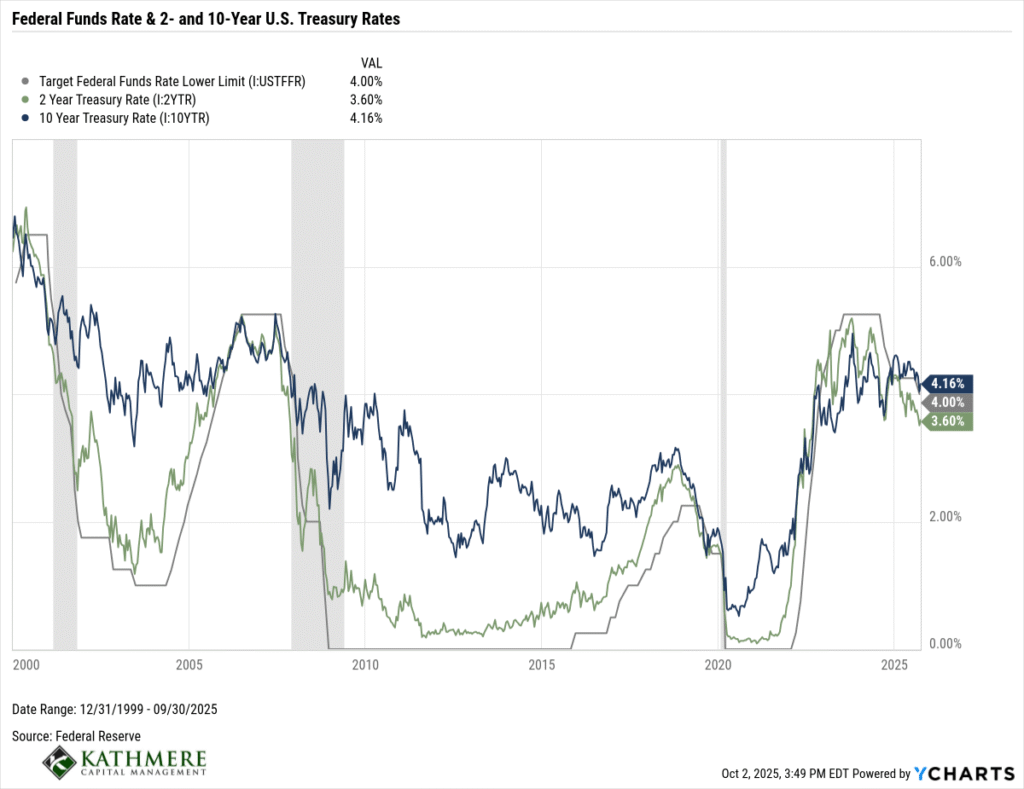
The Federal Reserve resumed its rate cutting cycle with a 0.25% cut to the Federal Funds rate in September and signaled that further cuts are likely through the rest of the year into 2026.
So, does that mean that the 10-Year Treasury yield and mortgage rates are definitely set to fall from here? Not quite.
It’s important to recognize that the Fed does not directly control either the 10-Year Treasury rate or mortgage rates. Instead, the Fed directly controls the overnight rate banks lend reserves to one another. This base rate in turn affects all other types of interest rates, the 10-Year Treasury and mortgages rates included. Crucially, however, the 10-Year Treasury yield is influenced less by current Fed policy and more by a variety of other economic forces (e.g., expected inflation, long-term real growth expectations and investors’ collective preferences for holding longer-term debt relative to shorter-dated debt).
The chart below shows the movements in the 10-Year Treasury yield have been at best indirectly related to changes in the Federal Funds rate.
Long story short: don’t expect the Fed alone to drive mortgage rates lower.
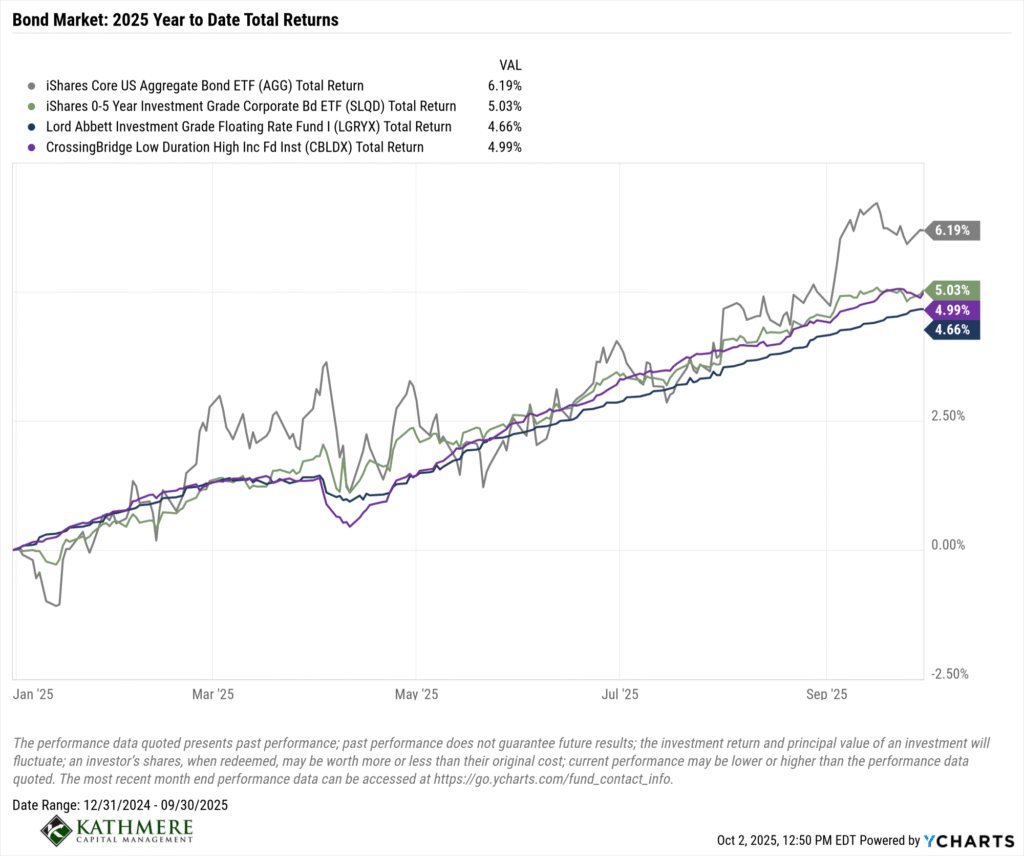
Generally declining interest rates combined with tightening credit spreads have resulted in strong performance for investment grade bonds thus far in 2025 with the broad U.S. investment-grade taxable universe (as proxied by the iShares Core US Aggregate Bond ETF) gaining nearly 6%.
While short-duration and floating rate investment grade bonds have slightly underperformed thus far in 2025, it’s important to recognize that they’ve done so with noticeably lower volatility which is what we believe most investors are looking for out of their fixed income allocations.
After modestly contracting in the first quarter, real GDP growth rebounded in the second quarter, growing by 3.8% on an annualized basis.
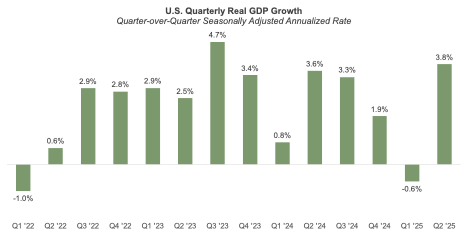 Source: U.S. Bureau of Economic Analysis, Real Gross Domestic Product [GDPC1], retrieved from FRED, Federal Reserve Bank of St. Louis; https://fred.stlouisfed.org/series/GDPC1, October 2, 2025.
Final private domestic demand is a key concept in GDP accounting that helps economists and investors assess the strength of an economy’s underlying momentum, excluding more volatile or externally influenced components. It’s a measure that captures the core engine of domestic economic activity driven by the private sector, excluding temporary swings in trade, government fiscal policy and inventory cycles. It’s often viewed as a better indicator of trend growth, especially during times when headline GDP may be distorted by trade dynamics or government stimulus.
The chart below shows that during the first half of the year final private domestic demand held up reasonably well and points to an economy where growth remains firm, albeit modestly slower than in the recent past.
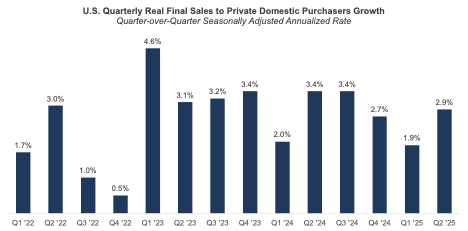 Source: U.S. Bureau of Economic Analysis, Real final sales to private domestic purchasers [PB0000031Q225SBEA], retrieved from FRED, Federal Reserve Bank of St. Louis; https://fred.stlouisfed.org/series/PB0000031Q225SBEA, October 2, 2025.
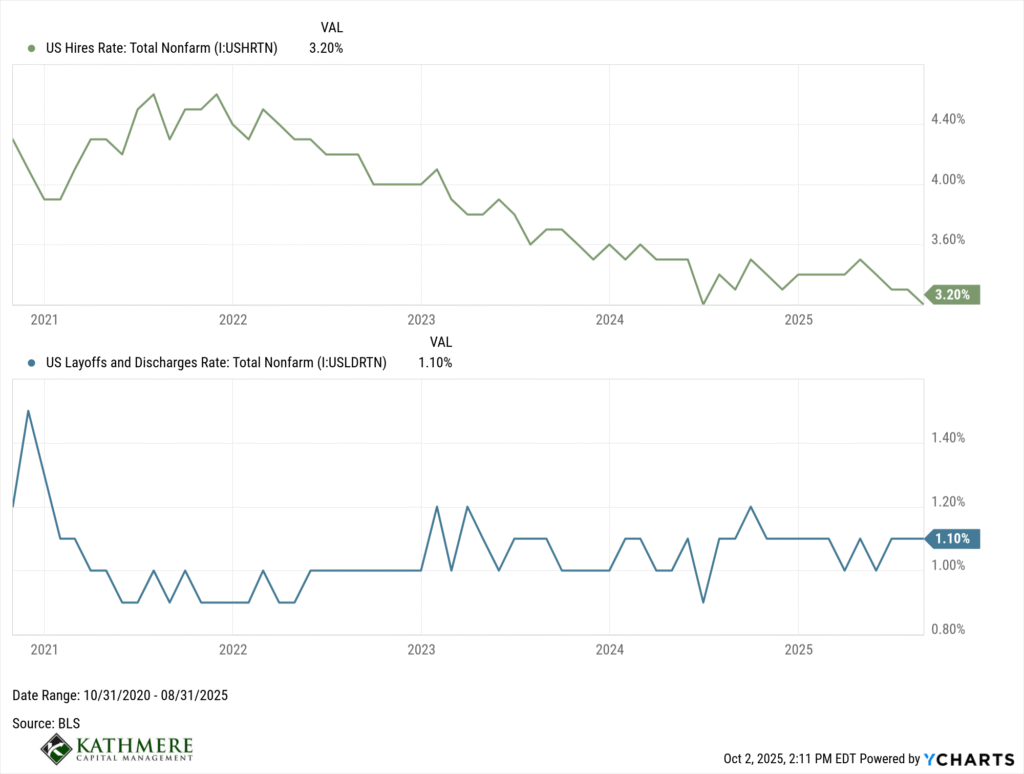
Labor markets appear to be in a delicate equilibrium currently characterized by both a reduced demand for and supply of labor.
The charts below show that (a) hiring has materially slowed over the last year and (b) that layoffs have held steady. Taken together, it seems that employers in aggregate have little need to grow their workforces (possibly because of improved productivity or because of a subdued outlook) yet are at the same time reluctant to or have no need to let go of their existing employees.
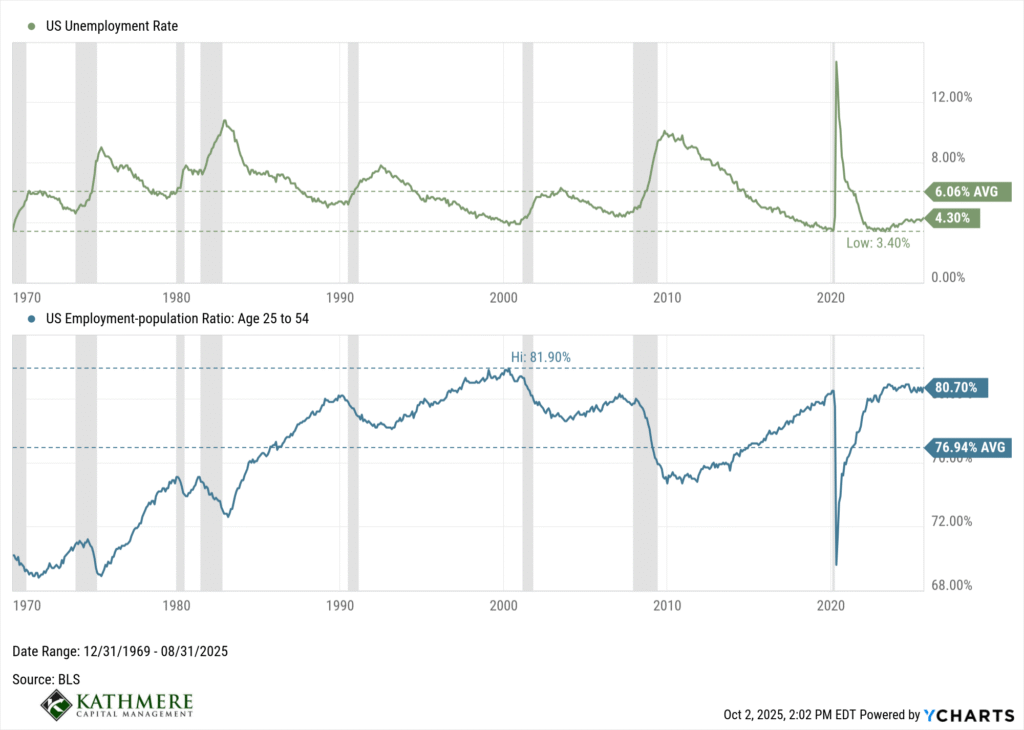
Further indicative of these dynamics, we see that the unemployment rate, although modestly higher than it was a year ago, remains at a generationally low level of 4.3%, indicative of a nearly fully employed labor force.
This is further reflected by the prime-age employment-to-population ratio. This measure is a key labor market indicator that measures the share of people ages 25 to 54 who are employed. Unlike the unemployment rate, which only counts people actively looking for work, this measure captures how many in that prime working-age group actually hold jobs relative to the total number of people in the group. Here we can see that this rate has remained relatively stable for some time now.
Pulling it all together from a macroeconomic perspective, we can examine the aggregate performance of a collection of indicators that are highlighted by the National Bureau of Economic Research (NBER) as the primary indicators used for consideration of business cycle turning points (i.e., the demarcation of recessions and expansions). The NBER defines a recession as “a significant decline in economic activity that is spread across the economy that lasts more than a few months.” Examining these indicators in aggregate suggests an economy that is growing, albeit at a subdued pace.
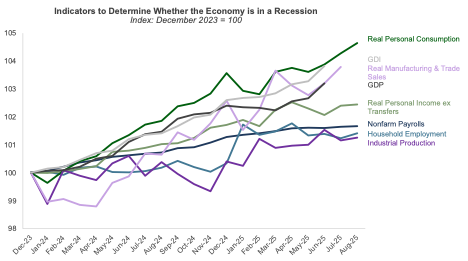 Source: Data retrieved from FRED, Federal Reserve Bank of St. Louis. 10/2/2025.